
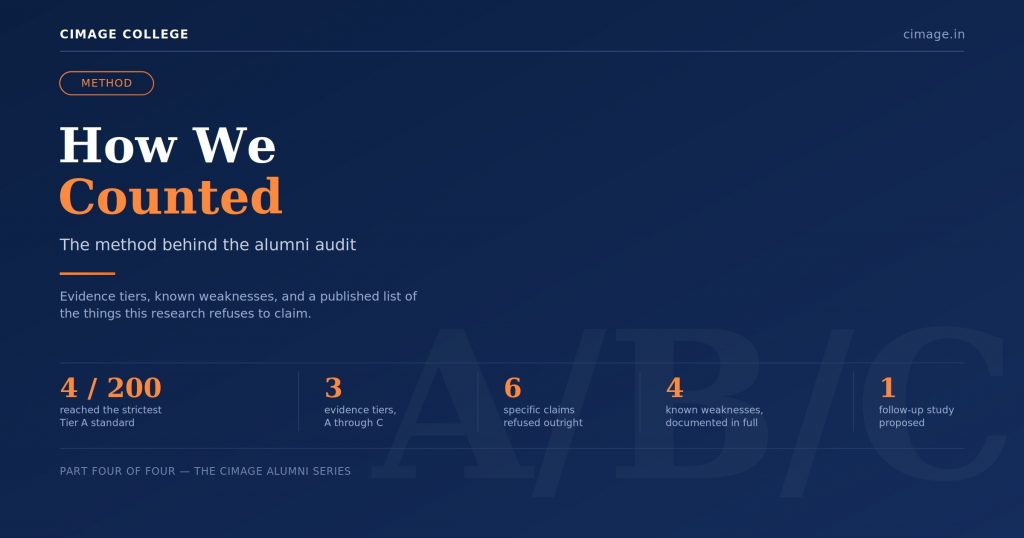
Evidence tiers, known weaknesses, and a published list of the things this research refuses to claim.
Research about one’s own institution has an obvious credibility problem, and there is only one way to address it: publish the method, publish the grading, and publish the things you could not establish. This piece does all three.
The method in six lines
- Two hundred named alumni outcomes assembled from institutional records and cross-checked against independently indexed profiles.
- Every entry graded A, B or C by the strength of its evidence — not by how impressive the outcome sounded.
- Only 4 of 200 reached Tier A. 32 reached Tier B. 164 are Tier C.
- Six specific claims are refused outright, and the reasons are published.
- Four known weaknesses are documented, including one that systematically favours the conclusion.
- A randomised follow-up study is proposed that could overturn the findings entirely.
In this article
How the roster was built
We assembled two hundred named alumni outcomes from CIMAGE’s placement record, its published offer letters, its documented success stories and its alumni meet material, then cross-checked against independently indexed LinkedIn profiles wherever those existed.
Each entry carries a programme, a batch where known, the outcome, a verification note and a source. Then every entry was graded — not by how impressive it sounded, but by how much weight the evidence could actually bear.
| Tier | Count | Share | Standard of evidence |
|---|---|---|---|
| A | 4 | 2% | Independent public-profile corroboration, or unusually strong multi-source evidence, for senior, major-employer, international or entrepreneurial achievement. |
| B | 32 | 16% | Strong documentary evidence — offer or appointment letters, or detailed alumni accounts — for senior, specialist, Big Four, management or high-value roles. |
| C | 164 | 82% | Documented major-employer outcome from institutional records. Genuine successes, but this audit makes no claim that these alumni currently hold senior 2026 titles. |
Four out of two hundred reached Tier A. That ratio is the most important number in this entire series, and it is deliberately unflattering. It says that the overwhelming majority of these outcomes are documented placements rather than independently verified senior careers — which is exactly what an honest institutional record should look like, and almost never what a placement page implies.
The temptation in this kind of exercise is to promote borderline cases upward, because a roster with forty Tier A entries reads better than one with four. Resisting that is the only thing that makes the four mean anything.
What separates the tiers in practice
The distinction is about who is attesting to the fact, and whether they had any reason to overstate it.
Tier C — the institution says so
A Tier C entry typically rests on a single institutional record: a student’s name against an employer in a placement list. That is genuine evidence of a placement having occurred. It is not evidence of anything that happened afterwards, and it originates from a party with an interest in the count being high. Eighty-two per cent of the roster sits here, and describing these as “notable alumni” without qualification would be the single easiest way to mislead a reader.
Tier B — an employer says so
A Tier B entry adds a document — an offer or appointment letter naming a role and often a figure. The employer, not the institution, generated that document, which makes it substantially harder to overstate. What it still cannot establish is currency: a letter proves a role was offered on a date, not that it is held today. A 2019 appointment letter is excellent evidence about 2019.
Tier A — someone with no stake says so
A Tier A entry requires corroboration from a source with no interest in the outcome — usually the graduate’s own independently indexed professional profile, ideally consistent with other traces. That is why there are only four. It is a demanding standard, and most genuinely true facts about most alumni simply cannot meet it from outside.
Note — A low Tier A count is not evidence that the other outcomes are false. It is evidence that they cannot be independently verified from public sources — which is a statement about the available evidence, not about the graduates.
What we refuse to claim
A short list, because the absences are load-bearing. Each of these is a claim the underlying data could easily be stretched to support, and each is one this research declines to make.
- That Microsoft or Amazon recruit on the CIMAGE campus. Alumni have reached both. That is a different sentence and it must stay a different sentence.
- Any count of alumni working abroad. LinkedIn does not publicly expose location data at that resolution, and an invented number would discredit every real one beside it.
- A comparative Big Four table across local institutions. Public alumni pages show only the top five employers, so Deloitte, PwC, KPMG and EY counts are invisible almost everywhere.
- That “13,500+” refers to 13,500 distinct individuals. Students in this record routinely hold several offers each — one is reported to have collected twenty-six. Until the counting basis is stated, offers and people cannot be distinguished.
- That Tier C alumni currently hold senior roles. They were placed at major employers. Where they are now is not established.
- Any percentage of alumni reaching management. The sample is not a census, and converting it into percentages would be fabrication with a decimal point.
Known weaknesses
1. The platform undercounts, and does so unevenly
Not every graduate uses LinkedIn, not every profile is publicly indexed, and many hide job titles. So absence of evidence for any institution is genuinely not evidence of absence, and this cuts against smaller and less-indexed institutions in the Part Two benchmark more than it cuts against CIMAGE.
2. The undercounting favours our own conclusion
This is the most important weakness and the one most likely to be glossed over. Graduates in government service, teaching, family businesses and the informal economy are far less likely to maintain a professional profile than those in corporate IT. Any LinkedIn-based method therefore structurally over-represents exactly the outcomes CIMAGE is strongest in, which means the reported gap should be read as an upper bound rather than a precise multiple.
3. Searching for impressive profiles finds impressive profiles
Any method that goes looking for successful alumni will find them at every institution. This is the single largest weakness in Part Three, and it is why that piece reports patterns rather than counts, and why its strongest individual findings concern graduates of another institution rather than CIMAGE’s own.
4. A roster is not a random sample
The two hundred entries were assembled from records of notable outcomes. They are therefore not representative of the median graduate, and nothing in this series should be read as describing a typical experience. That limitation is the direct motivation for the study proposed below.
One further caveat applies to every figure quoted anywhere in the series: alumni counts and employer percentages drift continuously as people update profiles and join or leave the platform. Every number is a reading at the time of writing, not a permanent fact.
How to apply this to any institution
The grading approach is not specific to one college. A family comparing options anywhere can apply the same three questions to any placement claim put in front of them.
| Question | Why it matters |
|---|---|
| Who is asserting this, and what is their interest? | An institution’s own list, an employer’s offer letter, and a graduate’s own profile carry very different weight — in that ascending order. |
| True now, or true once? | An offer letter from 2019 proves a role was offered in 2019. It establishes nothing about 2026, and the gap is where most misleading claims live. |
| Maximum, mean, or median? | Highest package is a maximum and describes exactly one student. Median describes the middle of the distribution and is the only one of the three that predicts a typical outcome. |
If an institution cannot answer those, that itself is information. If it can, the answers will tell you far more than any logo wall. CIMAGE’s own campus placement and industry interaction pages are the appropriate places to press these questions.
The study that would settle it
There is a cleaner design available, and it would be considerably harder to manipulate than anything in this series.
Take a randomised sample — say fifty identifiable graduates per institution, restricted to the 2012–2019 window — and classify every single one, including the unremarkable ones, into senior leadership, mid-management, specialist professional, regular executive, entrepreneurship, higher education, or unclear, plus India versus international.
Randomisation is what kills the cherry-picking problem. You would have to report the graduates whose careers went nowhere alongside the ones who reached a major product company, and the resulting distribution would be a real comparison rather than a gallery of highlights. It would also produce, for the first time in this area, a defensible median rather than a maximum.
It might well validate the conclusions in this series. It might also overturn them — it is entirely possible that a random fifty would show a far flatter distribution than the roster implies, and that would be worth knowing. Both outcomes would be more valuable than another placement brochure.
An institution that only publishes numbers it cannot be checked on is telling you something, and it is not what it thinks it is telling you.
Having published its offer letters, its evidence tiers and the four-in-two-hundred ratio, CIMAGE is in an unusually good position to run that study. The rest of the series — the outcomes, the evidence and the long run — is what the current evidence supports until somebody does.
Frequently asked questions
How can you verify a college’s placement claims?
Ask three questions of any claim: who is asserting it and what is their interest; whether the evidence shows it is true now or only that it was true once; and whether the impressive figure is a maximum, a mean or a median. Independent sources such as graduates’ own professional profiles carry more weight than institutional lists, because the people writing them have no stake in the marketing.
Why did only 4 of 200 alumni reach the top evidence tier?
Tier A requires corroboration from a source with no interest in the outcome — typically the graduate’s own independently indexed profile. That is a demanding standard, and most genuinely true facts about most alumni cannot meet it from outside. Publishing the low ratio rather than promoting borderline cases upward is what makes the four meaningful.
Does a low Tier A count mean the other outcomes are doubtful?
No. It means they cannot be independently verified from public sources. Tier B entries rest on offer and appointment letters generated by employers rather than the institution, which is strong evidence about the date of the offer. Tier C entries are documented placements. The tiers describe the strength of available proof, not the honesty of the record.
What is the difference between counting offers and counting students placed?
A student holding three offers can be counted once or three times. Strong students in this record routinely hold several offers, and one is reported to have collected twenty-six, so the two methods produce very different totals from identical underlying results. Neither is dishonest, but a headline figure is uninterpretable until the institution states which it used.
Is LinkedIn-based research reliable?
It is better than self-reported placement figures because it is not authored by the institutions being measured, but it undercounts systematically. Graduates in government service, teaching, family businesses and the informal economy are far less likely to maintain profiles, which means any LinkedIn method over-represents corporate IT outcomes — the very outcomes this research reports most favourably.
What would make this research stronger?
A randomised sample of around fifty identifiable 2012–2019 graduates per institution, with every one classified — including those whose careers went nowhere. Randomisation removes the cherry-picking problem and would produce a defensible median rather than a maximum. It could validate these conclusions or overturn them; both would be more useful than another brochure.
The rest of this series
- Beyond TCS and Wipro: What CIMAGE Alumni Actually Did Next — Two hundred documented outcomes from a Patna BCA and BBA college — graded by evidence, not by press release.
- The Alumni Footprint: What Independent Data Says About CIMAGE — Measured by where graduates say they work — not by what any institution says it achieved.
- Fourteen Years On: Where the 2012–2019 Graduates Are Now — Does an early placement advantage survive a decade? A cohort study of what happened after graduation.
Primary sources
Figures in this series are drawn from the following, read at the time of writing. LinkedIn aggregates change continuously.
